

![]() Note: Files are in Adobe (PDF) format.
Note: Files are in Adobe (PDF) format.
Please download the free Adobe Acrobat Reader to view these documents.
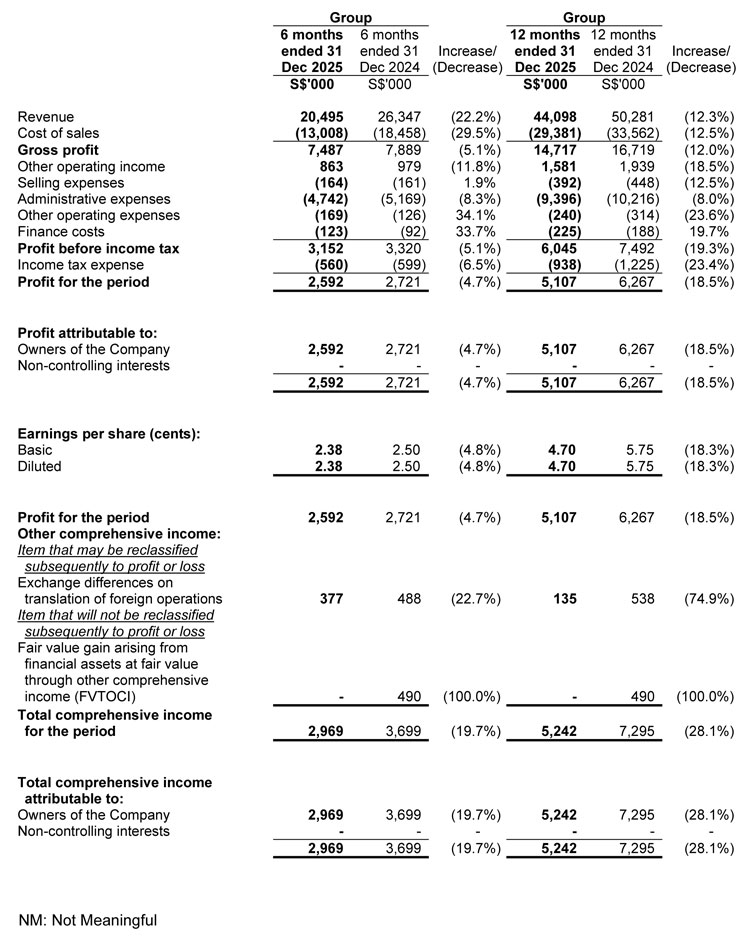
Condensed Statement of Profit or Loss and Other Comprehensive Income
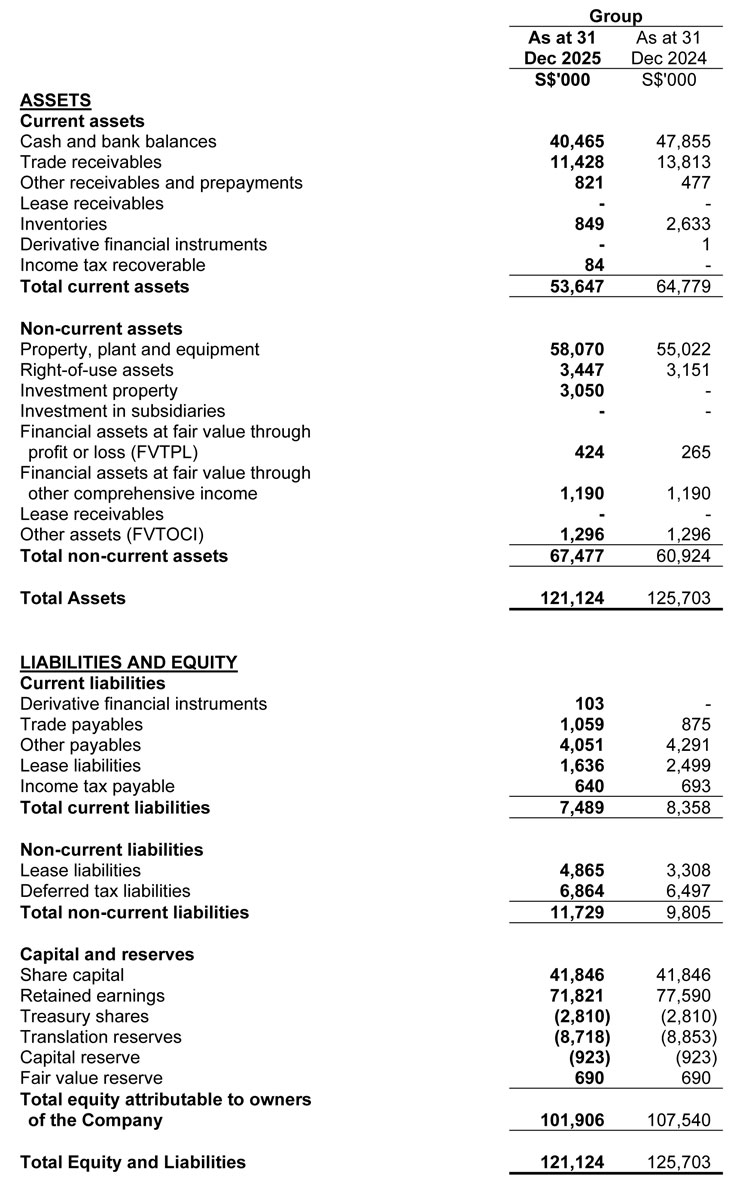
Statement of Financial Position
Review of Performance
Income Statement
Revenue
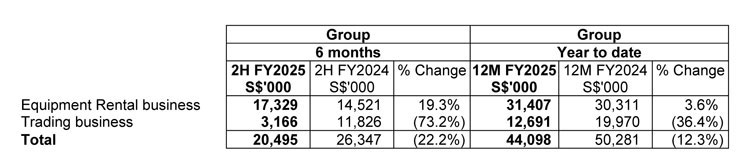
The Group registered a total revenue of S$20.5 million in 2H FY2025, which was 22.2% lower than 2H FY2024. Total revenue of S$44.1 million for 12M FY2025 was 12.3% lower as compared to 12M FY2024. The decrease was mainly due to lower revenue generated from Trading business.
Revenue from Equipment Rental business increased by 19.3% to S$17.3 million in 2H FY2025 and increased by 3.6% to S$31.4 million in 12M FY2025 as compared to the corresponding periods in FY2024 respectively. The increase was mainly due to the increased level of activities in Singapore's operations.
Revenue from Trading business decreased by 73.2% to S$3.2 million in 2H FY2025 and decreased by 36.4% to S$12.7 million in 12M FY2025 as compared to the corresponding periods in FY2024 respectively. The overall decrease was mainly due to the decrease in the number of equipment sold during the periods
Gross Profit
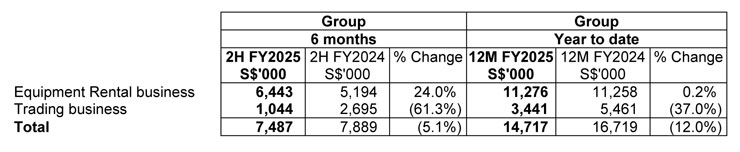
The Group registered a total gross profit of S$7.5 million in 2H FY2025 which was 5.1% lower than 2H FY2024. Total gross profit for 12M FY2025 was S$14.7 million and 12.0% lower as compared to 12M FY2024 mainly due to reduced contribution from the Group's Trading business. Gross profit margin for both business segments have slightly decreased from FY2024 to FY2025.
The Group registered a gross profit of S$6.4 million from Equipment Rental business in 2H FY2025 which was 24.0% higher than 2H FY2024. The gross profit for 12M FY2025 was S$11.3 million and 0.2% higher as compared to 12M FY2024. The increase in FY2025 was mainly attributed to the improved contribution as the result of different product mix offered to customers.
The Group registered a gross profit of S$1.0 million from Trading business in 2H FY2025 which was 61.3% lower than 2H FY2024. The gross profit for 12M FY2025 was S$3.4 million and 37.0% lower as compared to 12M FY2024. The decrease was in tandem with the decreased in trading revenue.
Other Operating Income
Other operating income decreased by S$0.1 million and S$0.4 million in 2H FY2025 and 12M FY2025 respectively as compared to the corresponding periods in FY2024 respectively. The overall decrease for 12M FY2025 was mainly due to the lower interest income and lower gain on disposal of property, plant and equipment in the current year.
Selling Expenses
Selling expenses remained constant in 2H FY2025 but decreased by S$0.1 million in 12M FY2025 as compared to the corresponding periods in FY2024 respectively. The decrease in 12M FY2025 was mainly due to lower entertainment and travelling expenses.
Administrative Expenses
Administrative expenses decreased by S$0.4 million and S$0.8 million in 2H FY2025 and 12M FY2025 respectively as compared to the corresponding periods in FY2024 respectively. The decrease was mainly due to decrease in staff related expenses and miscellaneous expenses.
Other Operating Expenses
Other operating expenses remained constant in 2H FY2025 but decreased by S$0.1 million in 12M FY2025 as compared to the corresponding periods in FY2024 respectively. The decrease was mainly due to lower property, plant and equipment written off and no bad debts were written off.
Finance Costs
Finance costs remained constant in both 2H FY2025 and 12M FY2025 respectively as compared to the corresponding periods in FY2024 respectively.
Income Tax Expenses
The Group recorded an income tax expense in 12M FY2025, mainly due to provision of current tax expenses for 12M FY2025.
Statement Of Financial Position
Current assets
As at 31 December 2025, current assets amounted to S$53.6 million or 44.3% of total assets. Current assets mainly comprise of cash and bank balances, trade and other receivables and inventories. Total current assets decreased by S$11.1 million as compared to 31 December 2024 mainly due to decrease in cash and bank balances, trade receivables and inventories, which was partially offset by increase in other receivables.
Non-current assets
As at 31 December 2025, non-current assets amounted to S$67.5 million or 55.7% of total assets. Non-current assets mainly comprise of property, plant and equipment, right-of-use assets and investment property. Total non-current assets increased by S$6.6 million as compared to 31 December 2024 mainly due to addition of property, plant and equipment and purchase of investment property, which was partially offset by depreciation of property, plant and equipment and right-of-use assets.
Current liabilities
As at 31 December 2025, current liabilities amounted to S$7.5 million or 39.0% of total liabilities. Current liabilities mainly comprise of trade and other payables and current portion of lease liabilities. Total current liabilities decreased by S$0.9 million as compared to 31 December 2024, mainly due to decrease in other payables, lease liabilities and income tax payable.
Non-current liabilities
As at 31 December 2025, non-current liabilities amounted to S$11.7 million or 61.0% of total liabilities. Non-current liabilities comprise of the non-current portion of lease liabilities and deferred tax liabilities. Total non-current liabilities increased by S$1.9 million as compared to 31 December 2024, mainly due to increase in hire purchase facilities.
Working Capital
As at 31 December 2025, the Group registered a positive working capital of S$46.1 million as compared to that of S$56.4 million as at 31 December 2024.
Equity
As at 31 December 2025, the Group's total equity stood at S$101.9 million. Total equity decreased by S$5.6 million as compared to 31 December 2024, mainly due to dividend payment, which was partially offset by profit for the year.
Statement Of Cash Flows
The Group's net cash generated from operating activities in 12M FY2025 was S$5.2 million. This comprised positive operating cash flows before changes in working capital of S$11.0 million, increase in net working capital flow of S$6.0 million, and offset by purchase of property, plant and equipment for rental use of S$11.1 million and income tax paid of S$0.7 million.
Net cash used in investing activities was S$11.4 million in 12M FY2025. This was mainly due to the placement of fixed deposits with maturity of more than 3 months of S$9.4 million, purchase of investment property of S$3.1 million and property, plant and equipment of S$0.1 million, and partially offset by the interest received of S$1.0 million and proceeds from disposal of property, plant and equipment of S$0.2 million.
Net cash used in financing activities was S$10.9 million in 12M FY2025. This was mainly due to the dividend paid of S$10.9 million, repayment of lease liabilities of S$3.3 million and interest expenses of S$0.2 million, and partially offset by proceeds from hire purchase facility of S$3.5 million.
After taking into consideration of the above movements, cash and cash equivalents in the statement of cash flows decreased by S$17.1 million to S$11.9 million as at 31 December 2025.
Commentary On Current Year Prospects
According to the media released by Building and Construction Authority ("BCA") dated 22 January 2026, the projected construction demand is estimated to be between S$47 billion and S$53 billion in nominal terms and between S$43 billion and S$46 billion in real terms. This demand will be supported by the major infrastructure and development projects such as Changi Airport Terminal 5, Marina Bay Sands Integrated Resort expansion, new hospitals, and MRT line extensions, alongside continued housing and institutional developments (1).
While we are cautiously optimistic about the outlook of Singapore's construction market, the broader landscape remains challenging. Geopolitical tensions, interest rate volatility, and fluctuating exchange rates continue to create uncertainty. To navigate this, the Group is prioritising disciplined cash management while exploring new growth opportunities that align with our long-term strategic goal.
(1)https://www1.bca.gov.sg/about-us/news-and-publications/media-releases/2026/01/22/steady-construction-demand-in-2026-as-singapore-steps-up-support-for-built-environment-firms-through-collaboration-and-innovation